
You can’t gauge your success if you can’t measure it to begin with. Fortunately, the modern digital world of comms is one awash in numbers. Open rates, engagement rates, click rates, subscription rates – there’s a number for everything!
But even once you have the email statistics and other metrics at your disposal, what are you to do with them? Is a 20 percent open rate good or bad? Is the number of subscriptions per subscriber on track if it’s hovering around two?
Granicus set out to provide clarity to the public sector by releasing the 2018 Benchmark Report—the only major communications report that focuses exclusively on numbers government can use for apples-to-apples comparisons. We think this is important, because government consistently meets or exceeds the private and nonprofit sectors when looking at the numbers. Our 2018 numbers were pulled directly from GovDelivery Communication Cloud.
The report covers a number of different metrics and benchmarks, but today in the blog we’re going to focus on email statistics. As you flip (or scroll) through the report, here’s an overview of what you should know and some topline results you’ll see:
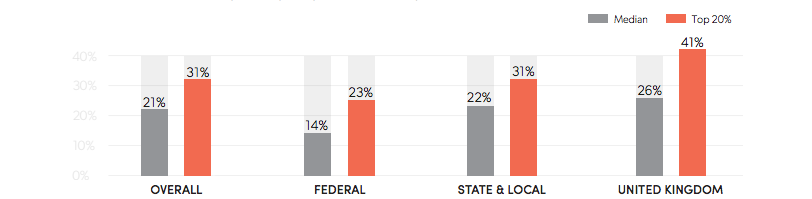
What is it? The number of recipients who opened an email compared to the number who received it.
2018 Numbers:
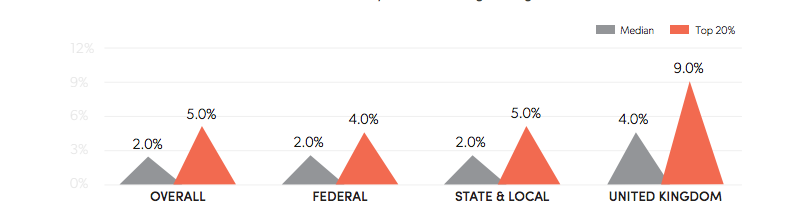
What is it? The number of recipients who click on an email compared to the total number that received it.
2018 Numbers:
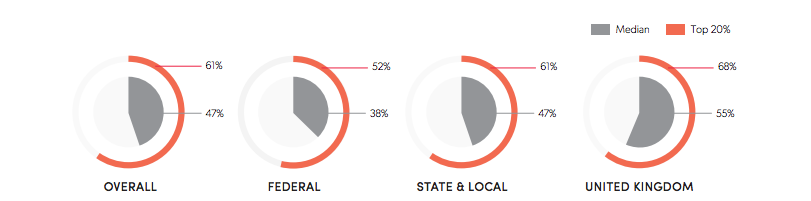
What is it? The number of unique email recipients who opened an email or clicked on a link in an email over a 90-day period, divided by the total number of email recipients who received an email during that time period.
2018 Numbers:
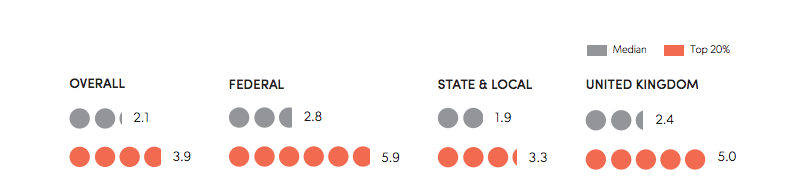
What is it? The number of topics for which an individual has signed up to receive email updates, calculated by dividing total subscriptions by total subscribers.
2018 Numbers:
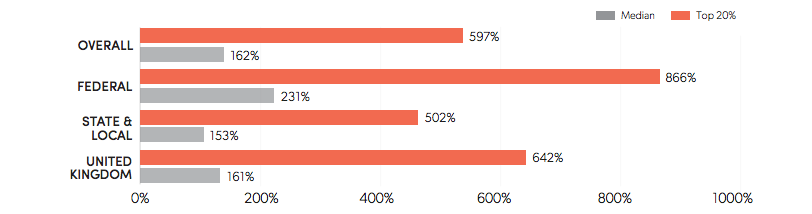
What is it? The total number of overlay subscribers divided by the total number of subscribers from direct signups.
2018 Numbers:
Want a deeper dive into each of these email statistics (including annual trends), tips for improving your metrics and case studies? Download the entire 2018 Granicus Benchmark Report now!