
In the modern era, a government website is effectively the organization’s front door: It’s where citizens likely have their first interaction with the agency—and where they form their first impressions.
That’s why every government website should strive to be a citizen-centric hub of information. But what are best practices, and which metrics should have an eye kept on them? To answer those questions, we put together the 2018 Granicus Benchmark Report. Last week, we looked at email statistics from the report. Today, we’re examining the high-level findings for websites that only Granicus can offer.
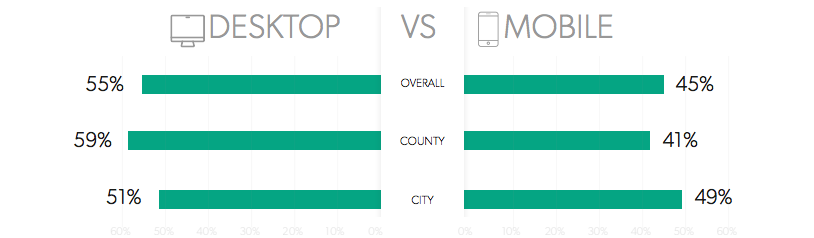
What is it? The percentage of visitors who access a government website from their desktop, smartphone or tablet. Mobile usage is surging and will soon overtake desktop as the primary method of access, so government website design should react accordingly.
2018 Numbers:
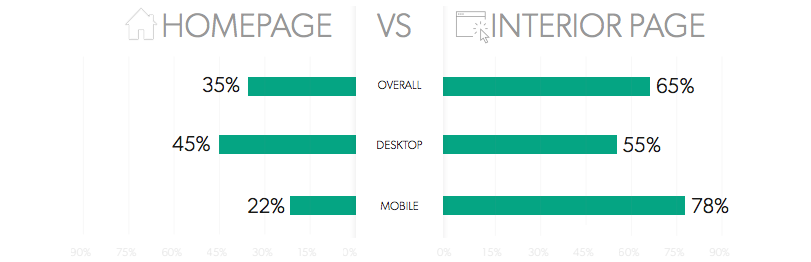
What is it? An entrance page is the initial page a user lands on when they visit a website. The home page is often not where people first arrive, especially when they are on a mobile device.
2018 Numbers:
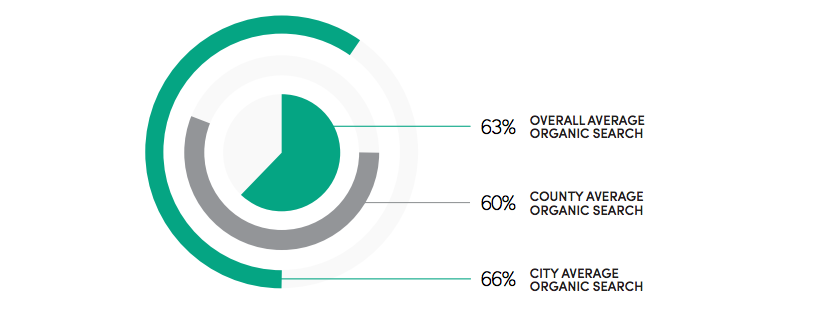
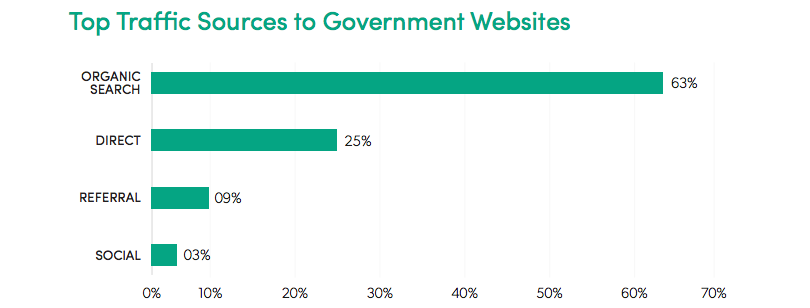
What is it? Website traffic sources are the origins through which people find your website.
2018 Numbers:
Want a deeper dive into each of these government website statistics (including annual trends), tips for improving your metrics and case studies? Download the entire 2018 Granicus Benchmark Report now!