
The only index quantifying FOIA for state and local government. The Peers in Public Records Index (PiPRIndex) tracks complexity over time and shows that managing requests for public records is getting harder.
Public Record Request Complexity 2018 – 2021
PiPR Index In the News
Quantifying Complexity in Public Records
Making Sense of the Complexity Report
Calculating Public Records Complexity
Since it launched in 2020, the PiPRIndex has become the standard for measuring growth in FOIA (Public/Open Records) requests for state and local government.
As the Gov Tech market leader in cloud-based automated workflow (SaaS) software for governments, GovQA is singularly positioned to provide this actionable barometer for the public records industry.
Anonymized data from GovQA’s broad and diverse customer base, brings to light important trends affecting state, county and city governments on a quarterly basis.
This report, the first of the four Peers in Public Records Index reports, covers Complexity. Below we break this down by:
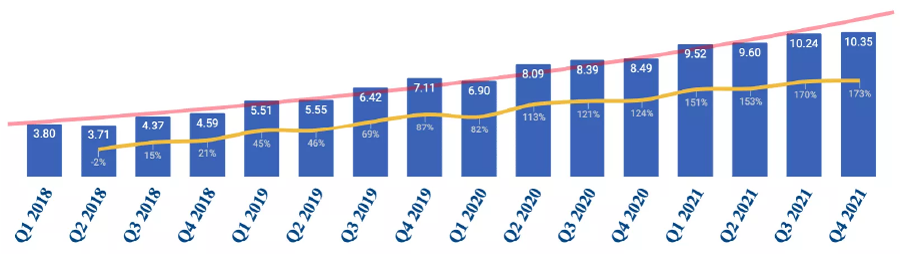
Q4 2021 Data: Public Records Complexity has increased 173% since Q1 2018
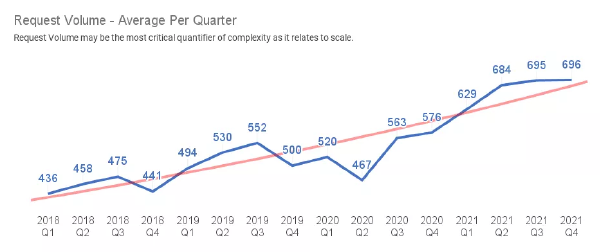
Request Volume
Request Volume may be the most critical quantifier of complexity as it relates to scale.
*2018 study from Sunlight Foundation
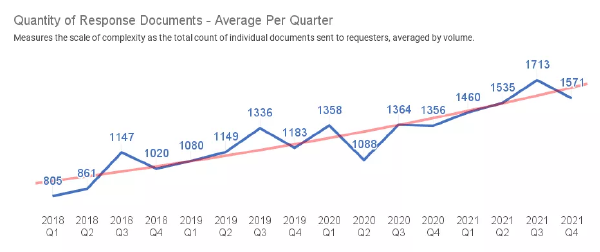
Quantity of Documents
Measures the scale of complexity as the total count of individual documents sent to requesters, averaged by volume.
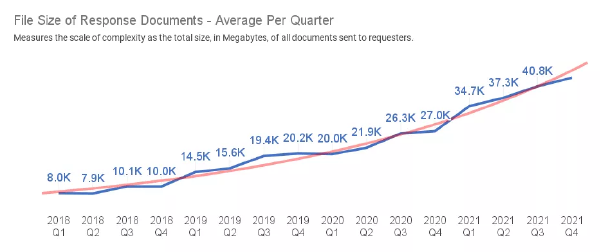
File Size
Measures the scale of complexity as the total size, in Megabytes, of all documents sent to requesters.
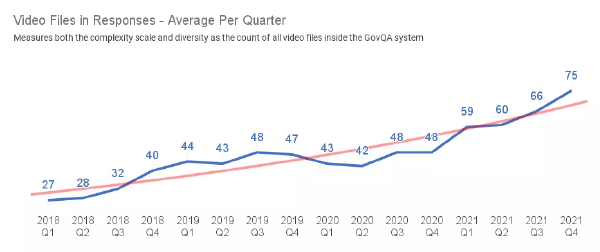
Video Files
Measures both the complexity scale and diversity as the count of all video files inside the GovQA system
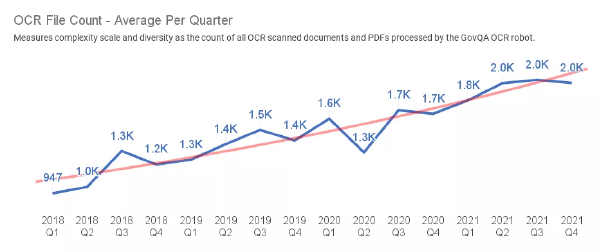
ORC Files
Measures both the complexity scale and diversity as the count of all OCR scanned documents and PDFs processed by the GovQA OCR robot
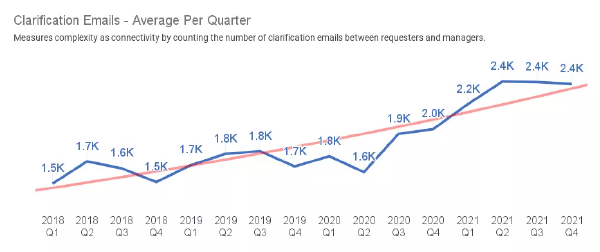
Clarification Emails
Measures complexity as connectivity by counting the number of clarification emails generated between requesters and those managing requests.
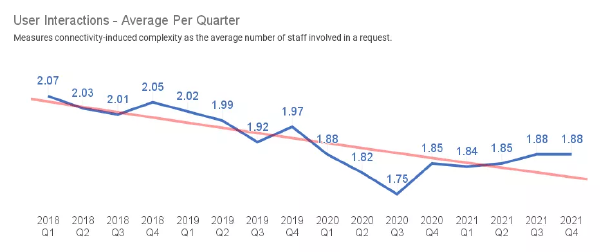
User Interactions
Measures connectivity-induced complexity as the average number of staff involved in a request.
*GovQA user interactions trend downward as workflow automations are optimized in the software. Agencies do more with fewer staff when using automated software.
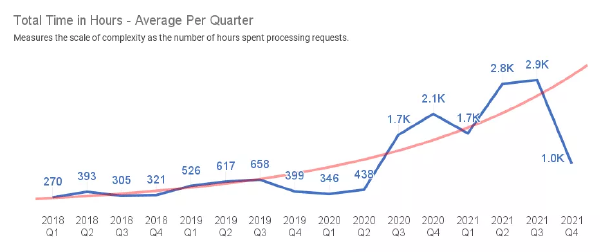
Total Time Spent
Measures the scale of complexity as the number of hours spent processing requests. Many things can affect total time:
The GovQA Complexity Index is composed of two markers: the Records Marker; and the Activities Marker.
To calculate the Complexity Index, the Records and Activities Markers are weighted against Request Volume – which is the total count of public records requests received by an agency.
Records Marker:
The Records Marker is an indicator of the complexity of
the public record files themselves. It includes:
Activities Marker:
The Activities Marker is an indicator of user activities
related to processing public records requests. It includes:
Complexity, by definition, is the state of being intricate or complicated – having many interconnected parts or features. The causes of complexity as they relate to public records are:
These factors have been identified in the vast GovQA anonymized blind data sets and grouped for convenient analysis and use as a decision-making tool for government leaders.
To calculate complexity, we started with the data of 500 anonymized member agencies, then removed the outliers at the very highest and lowest ends of the spectrum across all metrics, leaving us with ±240 members that represented the most common experience across all 8 metrics.
Adjusted for volume and tracked quarterly, GovQA is able to quantify the predictable growth in the complexity organizations will continue to face across the country.
Complexity as a Catalyst
“Requests are increasing in complexity. Litigation throws sand in the gears of operations. It’s getting more and more difficult over time. So we must embrace new techniques and methodologies if we’re going to continue on the course of improvement that we’re all seeking here in this profession.”
– Michael Sarich, Director Veterans Health Administration, FOIA program and co-chair of the CFO Technology Subcommittee to OGIS stated at a recent FOIA Advisory Committee meeting