In an earlier blog post, we provided an introduction to Google Analytics. This follow-up post shows you how to uncover some interesting insights when you take a deeper dive into the analytical results. It also points out the importance of looking beyond the surface to include trends, comparable data periods and benchmarks in your analysis.
We will help you answer the following questions:
The answer: mobile traffic is critically important. Traffic from smartphone and tablet devices has grown fairly quickly over the past few years, and now accounts for nearly 50% of all traffic to local government websites. Google Analytics makes it easy to identify mobile traffic on the Audience Tab, under Mobile Overview. You can look at mobile data for a specific period of time, like one month or one quarter; or track larger trends over time by looking at year-over-year data.
In addition to looking at how much traffic is coming from a mobile device, it’s also interesting to review other website benchmark data to see how your city or county website compares in categories like traffic sources, bounce rate, pages per session, and average session duration by device. For example, a common trend you may see is that desktop visitors have a far lower bounce rate, and above average pages per session and average session duration when compared to mobile visitors. This makes sense as people using their phones are probably looking for a specific page or piece of content, and they leave as soon as they find it. Another common trend is that the majority of people visiting your website from a mobile device may land on an interior page vs. the homepage – likely because they are doing a quick search for common mobile tasks like “parks and rec” or “contact police” that routes them to a specific page on your website.
To enhance the experience for your mobile users, invest in responsive website design. Make navigation from a mobile device more intuitive by building an app-like interface for your mobile website with large icons and quick links to the top mobile tasks; and be sure to regularly monitor Google Analytics to track top pages by device and optimize accordingly. For benchmarks on top mobile tasks, download our new city and county whitepapers.
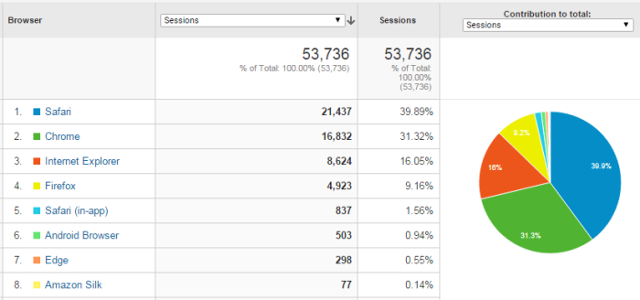
Another interesting insight can be found by analyzing the technology used to access your website. In this example, 40% of the website visitors are using a Safari browser, 31% use Chrome and 16% use Internet Explorer. This information can be used as a proxy for the technical preferences for your community. You can find this information by going to the Audience tab, Browser & OS page under Technology.
Google Analytics also provides you with the geographic location of your website’s visitors. This can be interesting from many different angles. This information is found under the Audience tab, Geo and Location page. The page opens with a world map and you can then zoom into your state or regional area.
If your community is a destination or vacation spot, you can use this information to provide resources or information to make sure that your website is meeting these users’ needs. Since tourism can be a boost for the local economy, you may want to work with your chamber of commerce or tourism board to develop joint programs to attract similar visitors.
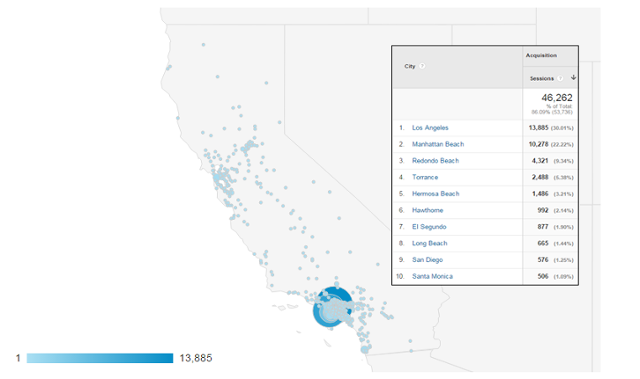
Another insight from the example below points out that more than 50% of the website traffic comes from communities within a 10 mile radius. This community is a regional draw which can be exploited on the website by creating content to make local visitors feel welcome and by cross-promoting community activities in local newspapers and other outlets.
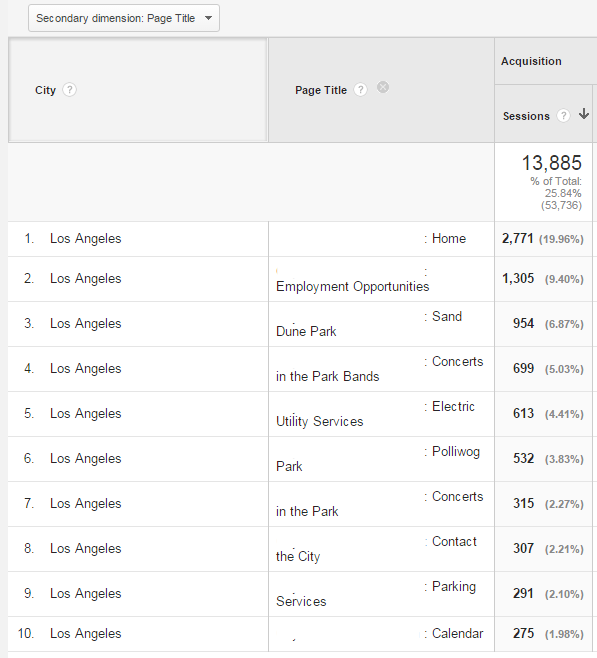
You can also add a Secondary dimension to the Geo report and select Page Title (under Behavior) to view which pages are the most popular with a given geography. In this example, the top pages coming from Los Angeles include Employment Opportunities, Concerts in the Park, Polliwog Park, Contact the City and Parking Services.
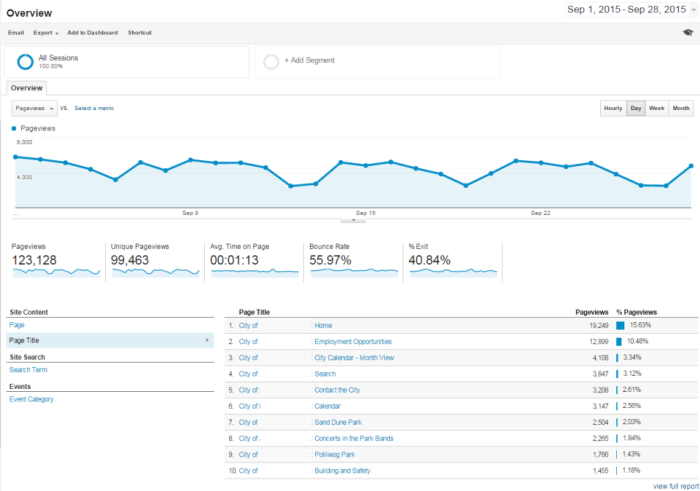
Did you ever wonder which pages are the most popular on your site? You can discover this information by going to the Behavior Site Content section of Google Analytics.
In this example, the top visited pages include Employment Opportunities, City Calendar, Search and Contact the City. Using this information, you can make sure that links to these pages are easily found on your home page. You could even experiment by creating larger buttons for the most important content and ensuring that the content on these pages is well-written, organized and up-to-date. For additional insights on the most popular local government website pages, check out our whitepapers on top city website tasks and top county website tasks.
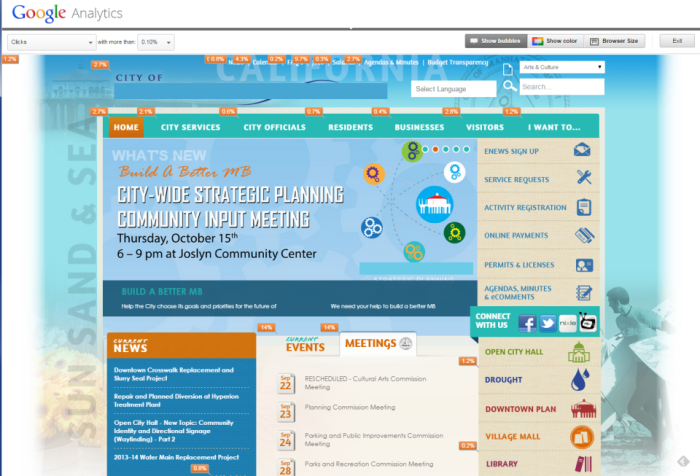
The In-Page Analytics analysis identifies where people are clicking on your site and the percentage of clicks to the total clicks. This is an interesting page to review on a regular basis to make sure you have optimized the content on your homepage to deliver what your customers are regularly seeking.
After analyzing the results of this page, you may want to consider moving buttons or content to different parts of the page to increase visibility and clicks, or de-emphasize less popular links and content. You can access this feature by going to the Behavior section and selecting In-Page Analytics.
We have only scratched a fraction of what can be analyzed with Google Analytics, and hopefully these examples will provide useful information for your own analytics. For more details about how you can leverage Google Analytics to optimize your website, download our Google Analytics Guide.