When leading the City of Raymore’s site redesign, Communications Director, Mike Ekey operated from a place of “both complete freedom and utter disadvantage.” Brand new to local government, and working with limited data, Mike jumped in and saw nothing but opportunity. Today, the results speak for themselves — Raymore’s search-centric website is now a lean, mean, steered by analytics, machine!
There’s a real emphasis on requested items on your website. Why did you chose this design format?
Unfortunately, with our previous site, we had very limited functionality and analytics.
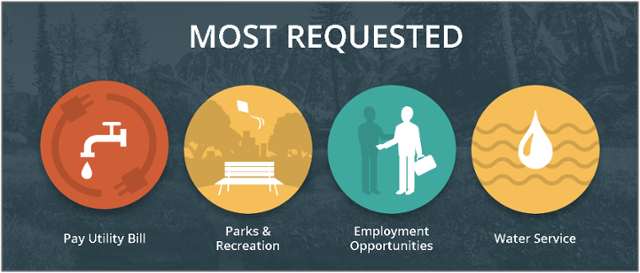
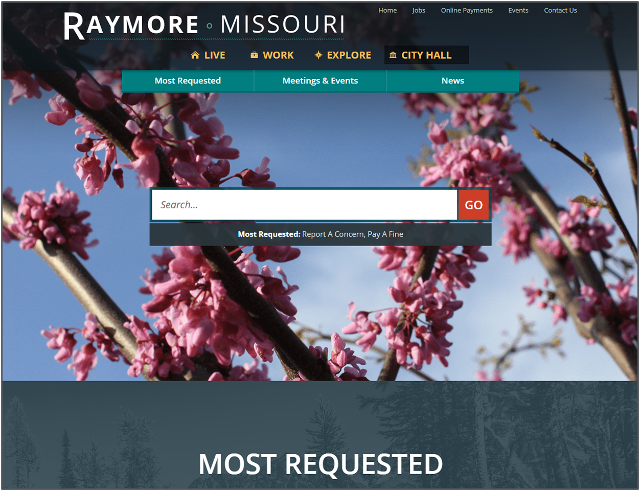
Instead of looking at the glass as half empty, I saw it as half full. So we approached the project as starting completely clean. Initially, I focused on the homepage, which had 50 or 60 links. Thanks to Granicus, heatmapping and click mapping we saw that that none of these links were clicked on, so we got rid of them. The only data point(s) I had to work with from the original site were page views. From the report, I could see that parks, job listings and pay utilities were the most requested pages. From there, I made it a formal goal to keep the homepage clean and limit links to the most requested items. Additionally, we learned from the click map that people were going right to the search bar, so we made that the focal point of the page.
We find it really informative to report on the search terms. For instance, it helped us anticipate what our messaging should be for the summer. Come late spring, we saw that people were searching for yard waste pick-up dates. So, we devised an entire integrated campaign around it.
How many pages was your old site? Did you have a methodology to get you to your current site size?
Size-wise we were at about 1,000 pages, but coming from a university that had about 10,000 pages, I understood how that growth happens. Ultimately, we got it down to about 100 pages. First, we examined what content we were legally required to present. We then looked at a year’s worth of page-views and created a marker. If the page didn’t get 100 views in a year, we cut it. There was an incredible long tail from the old website. It was incredible to see how quickly the number of views trail off. One of the components of our content strategy for the new site was to get the resident where they need to be in two or three clicks.
It must have been difficult to be new employee with a highly visible new project. How did you manage it?
I did a lot of research and asked a lot of questions. Coming in, I knew the website was outdated by just looking at it. I surveyed the staff and asked them if the site met legal requirements, their department functional goals and their informational goals. Much of the material was outdated, so the answer was “no.” It was interesting to discover how many of our front-line staff didn’t use the website at all. There was no site-wide, systematic strategy in place, so governance varied from department to department. From a high-level, there was no connecting of the dots between departments. Thus, we put together various departmental and intra departmental committees to address this.
How does the site serve the residents of Raymore?
The website acts as a storefront. Ninety percent of the time this is where people go before they step foot in City Hall. I’ve learned that if residents don’t have a good experience online, they show up at City Hall, quite upset. This, thankfully, is very, very rare.
We see the website as housing two types of content: transactional and community-connector. Most of the traffic to the website is very transactional, like paying a water bill or conducting business, and this is by design. The community-connector content –such as events or news – we use social media to drive. Often when we see search term traffic spike around an event or term we try to support it with the appropriate social or digital media. For example, it was a warm spring, so we had a lot of traffic for the yard waste pick-up dates on the website. To support the influx, we sent messaging about other drop-off locations using social media. It was neat to follow the traffic spikes, first the website, then social media (with links to the website) and about a week later, the website again. It even neater to pull this together into a presentation to our city council. We were able to show them “here’s how we are responding in real-time” using our technology.
Social media has come up a few times now. What are you doing with social that you feel is unique?
We conduct a lot of customer service using social media. Folks come to our Facebook page and expect a response. We are also dialoguing on community forums. I really like getting the requests digitally, the trackability of the interaction proves that we (the city) is available 24/7. I can correlate the launch of the new site with heightened expectations of all of our online tools. Hence, the website is at the core of what we do.
How often do you review analytics?
We do several types of reporting on different cadences. Weekly, I look at the search terms and the page views. govAccess reporting does a good job of showing the broken links and who has been reporting those. I also do a bigger monthly report up to our City Manager and Council that talks about broader initiatives. It’s important to prove information is really getting out there. Quarterly, we do a deeper dive into analytics regarding conversion. We want to ensure that people are truly getting through transactions on the website.
How important is mobile to the city?
Fifty three percent of our traffic is from mobile. I can tell which media channel is resonating with which demographic. We send out a weekly recap newsletter on Friday’s that is primarily opened up through mobile and the visits then come to the site via mobile. On Monday’s we do a weekly blotter. That one is primarily opened via desktop. My read on it is the younger crowd is looking for what is going on in the city over the weekend using mobile. The Monday newsletter covers the week’s activities, so that draws an older crowd.
How do the demographics of the city affect your digital communications strategy?
Our typical resident is typically a bit older, upper-middle class, has access to the internet and is Facebook savvy. In the last year and a half we’ve seen an interesting shift in demographics, young families who engage with social media to connect deeply with their community. The surveying we do shows that these new residents are looking for information about culture and the arts to build those deep community connections. While arts and culture are already reflected on the website, we need to model some sort of strategy on Facebook or Instagram to make them feel like they are involved.
If you’re looking to build a strong digital presence like the City of Raymore, contact us for a free consultation to get started.