
As we move forward into 2021 and begin incorporating lessons and efficiencies created in the past year, metrics remain a backbone for developing impactful communications and gauging the impact of messaging on an audience.
And, as with every year, government communicators find themselves asking the common questions that come with digital metrics:
Our series of Citizen Engagement Benchmarks helps answer these questions by diving into the reporting data from the various Granicus digital tools governments use to communicate with their citizens. This installment focuses on trends in government website design seen in 2020. How citizens access your website, where they enter it, and where they find you can provide important insight into creating an experience that focuses on convenience and efficiency. And that means happier citizens.
About Our Data
The metrics in this report are based on annual data gathered between June 2019 and December 2020 from the 4,500 U.S. federal, state, local, and transit (SLT); and U.K. organizations that use Granicus’ govDelivery, govAccess, and govService solutions. For website metrics, figures represent the average. A single, overall figure is provided for each U.K. metric.
What does it mean?
With technology increasing the ways that people can access information, “device usage” refers to the type of devices used by visitors accessing a website. Whether from their desktop, smartphone or tablet, users look for a consistent, but convenient, experience online
How do I rate in comparison to my peers?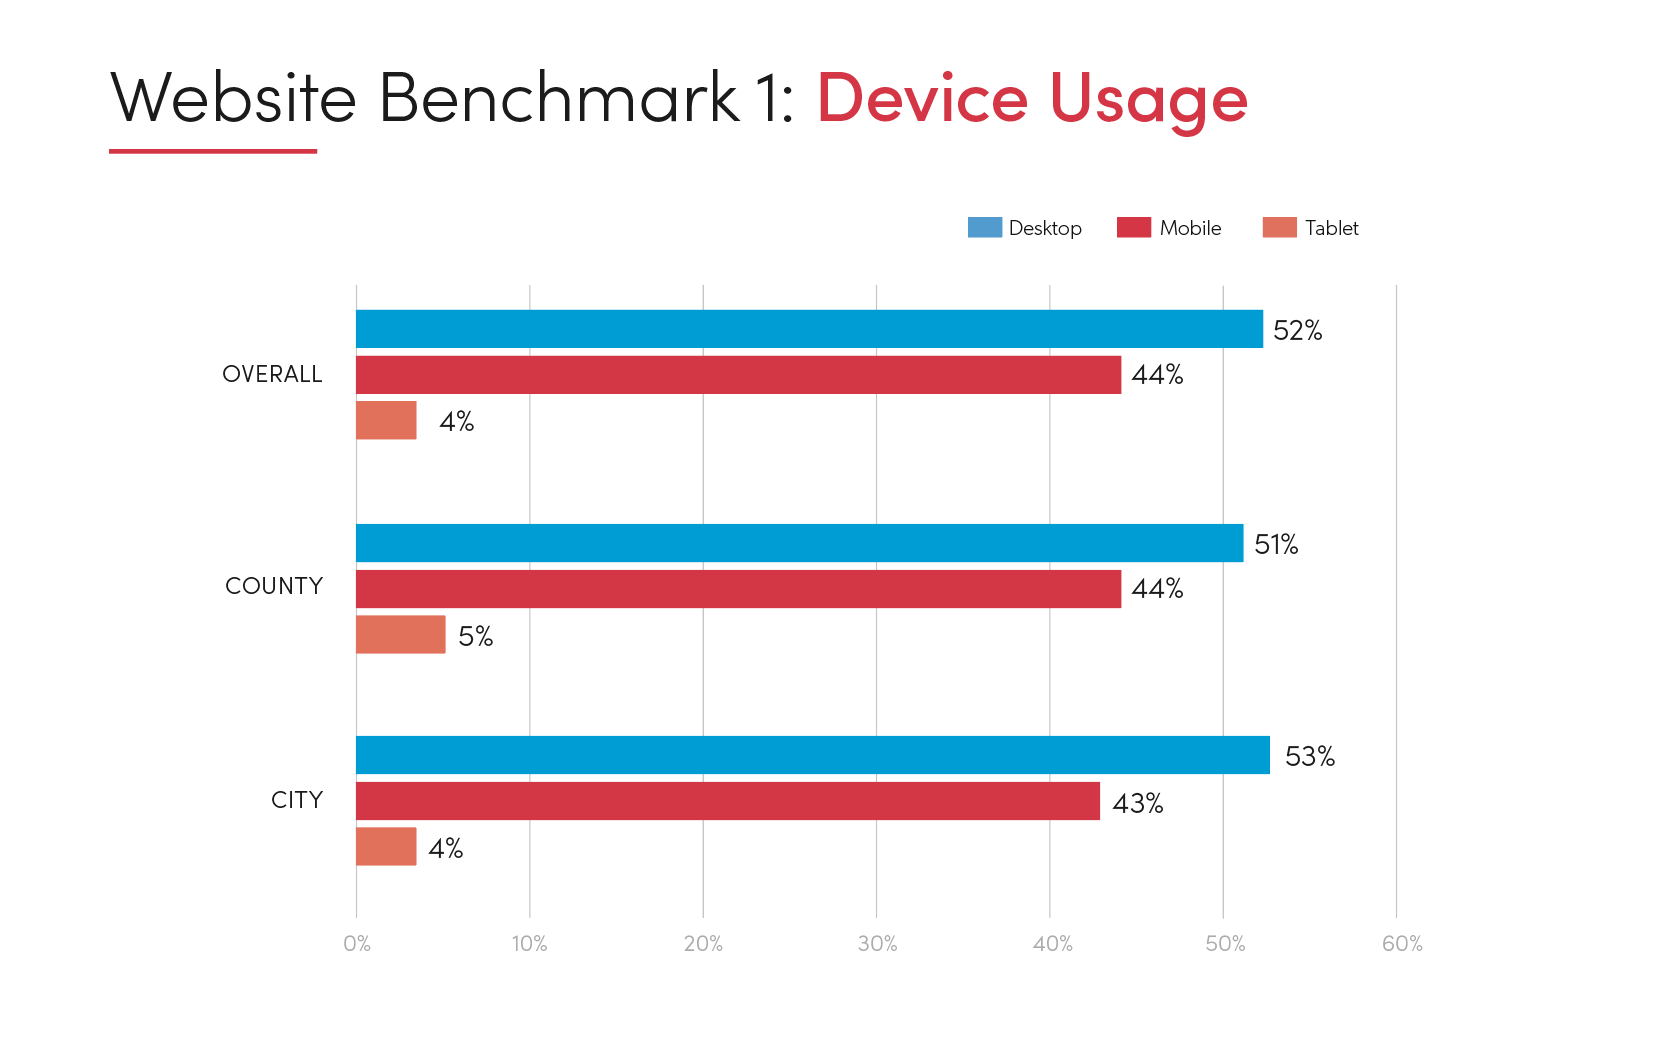
Our research reveals that while just a little over half the traffic to local government websites still comes from a desktop computer, mobile devices still maintain a sizeable presence at nearly 45%. This number might be down versus recent years due to COVID-19, but it indicates that mobile-friendly websites remain an important part of any government communications plan.
How can data be acted upon?
Device usage is an important metric to monitor because, among other things, it shows how users access your content. This can help you evaluate how a user’s experience may differ based on the device they use and adjust as necessary. For example, those pages with higher mobile device traffic should always incorporate the latest in mobile website optimization.
To keep pace with citizen expectations and mobile growth trends, it’s imperative to invest in mobile-responsive website design. Strive to make it as easy as possible for visitors to find what they are looking for and easily complete tasks from any device.
Making navigation more intuitive can benefit both mobile and desktop visitors. Create an app-like interface for your mobile website by featuring large tile icons, buttons and text, and quick links to top tasks.
What does it mean?
An entrance page is the initial page a user lands on when they visit your website, whether it’s the homepage or a page within your website.
How do I rate in comparison to my peers?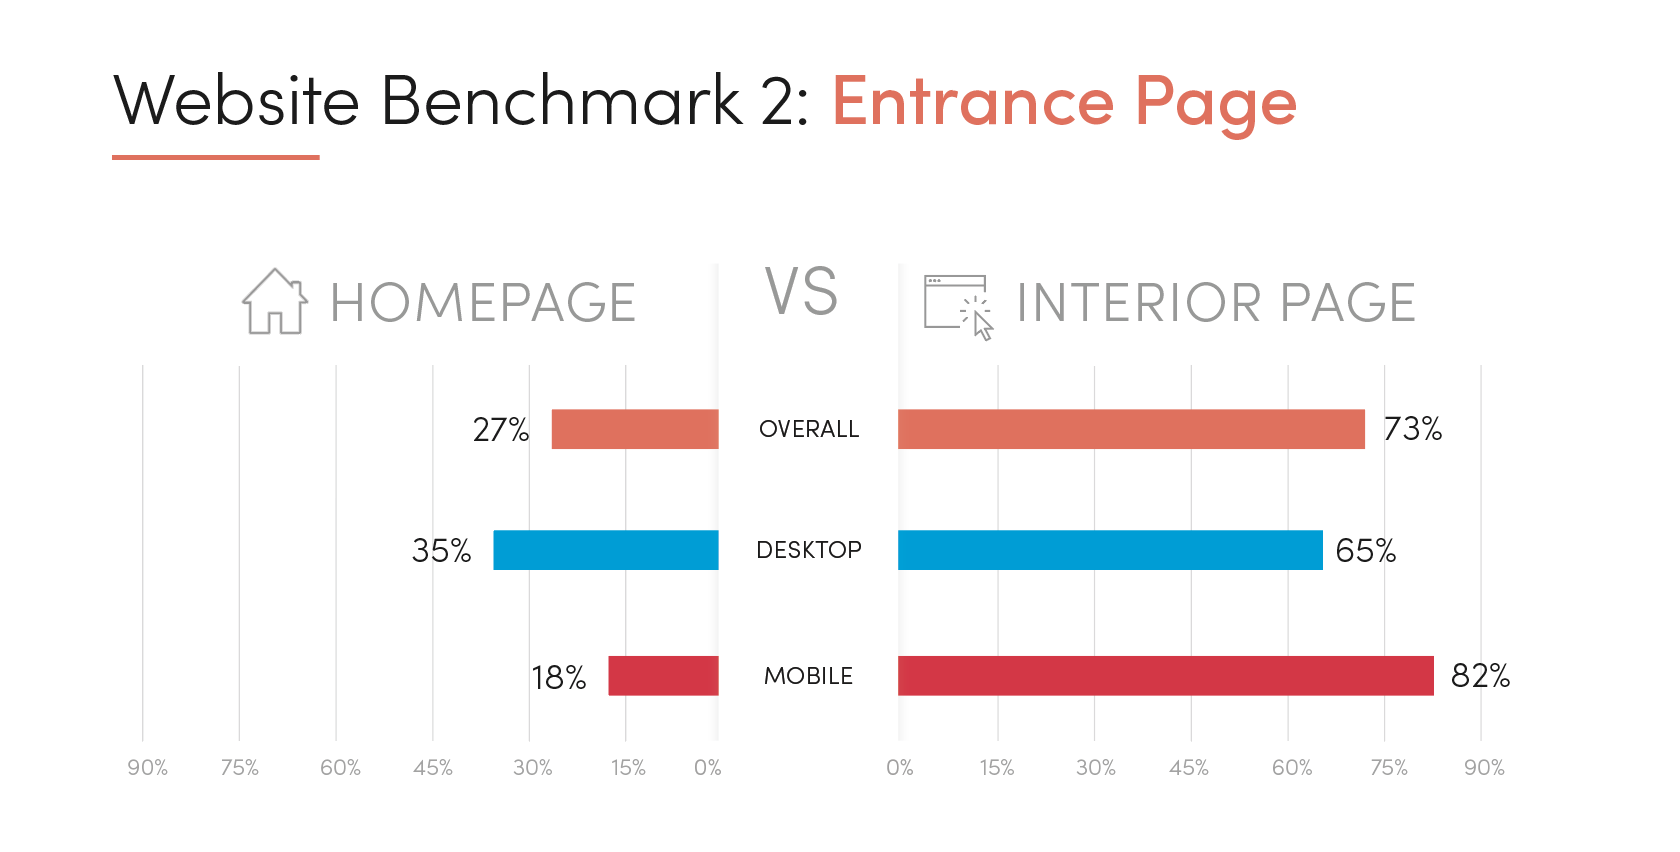
How can data be acted upon?
Most people assume that the homepage of their website is the primary entrance page for visitors to their website. But that isn’t always the case. In fact, our research showed that 73% of visitors accessed a government website by way of an interior page. For mobile sessions that increased to 82%.
Knowing where your visitors are making their initial contact with your website can help you better optimize content beyond the homepage and design a more efficient and effective website. Citizens who enter your website through an interior page may never see your actual homepage, so get the most out of those visits by treating your top interior pages as “mini-homepages.”
Use unique branding (imagery, font, colors) and navigation to take advantage of the traffic these popular pages bring. For highly trafficked interior pages, consider building a subsite with a unique URL to further differentiate it from the main agency website.
What does it mean?
Website traffic sources are the origins through which people find your website. This can be organic search (made through a search engine), direct traffic (when a user specifically enters a website’s URL into a browser) and referral traffic (when sites are visited through a link found on a different website).
How do I rate in comparison to my peers?
How can data be acted upon?
Organic search continues to stand out as the primary source of local government website traffic, accounting for over 56% of traffic. Direct traffic saw a strong increase in growth in 2020, rating 33% of traffic (an over 7% increase from the previous year). With the importance of COVID-19-related information, users were looking to dial up their government directly to find the latest news and policy announcements.
To make sure that information is easily accessible through organic search, make sure communications staff and content contributors are trained on basic SEO practices, including top-ranking keywords in the title, alt image tags, meta descriptions and URL of relevant webpages whenever possible. Leveraging Google Keyword Planner will help identify popular search terms related to your content. It also helps to use a CMS that offers built-in SEO prompts to encourage good keyword tagging during the content creation process.
Metrics may come after a project has been executed, but they should also be considered a top priority when planning new projects. By identifying the metrics you hope to impact, you’ll soon find it easier to create communications with a reader’s needs and interests in mind.
If your organization isn’t already engaging in metric-driven analysis of communications projects, learn how govAccess can deliver the tools to take your digital communications to a higher, data-driven level.